Dashboard
CultureMonkey's Dashboard is a consolidated view of the survey responses gathered over time from the below surveys:
- All custom surveys
- Pulse survey
It does not include Lifecycle surveys as Lifecycle surveys solely aim towards understanding the employee's journey in the organisation.
The minimum threshold for the dashboard is 5, irrespective of the configured survey thresholds. Only the cohorts with more than 5 participants will be listed in the dashboard heatmap. This dashboard's minimum threshold cannot be modified.
The Admin Dashboard helps you get clear, focused data to make informed decisions and keep track of your team's feedback.
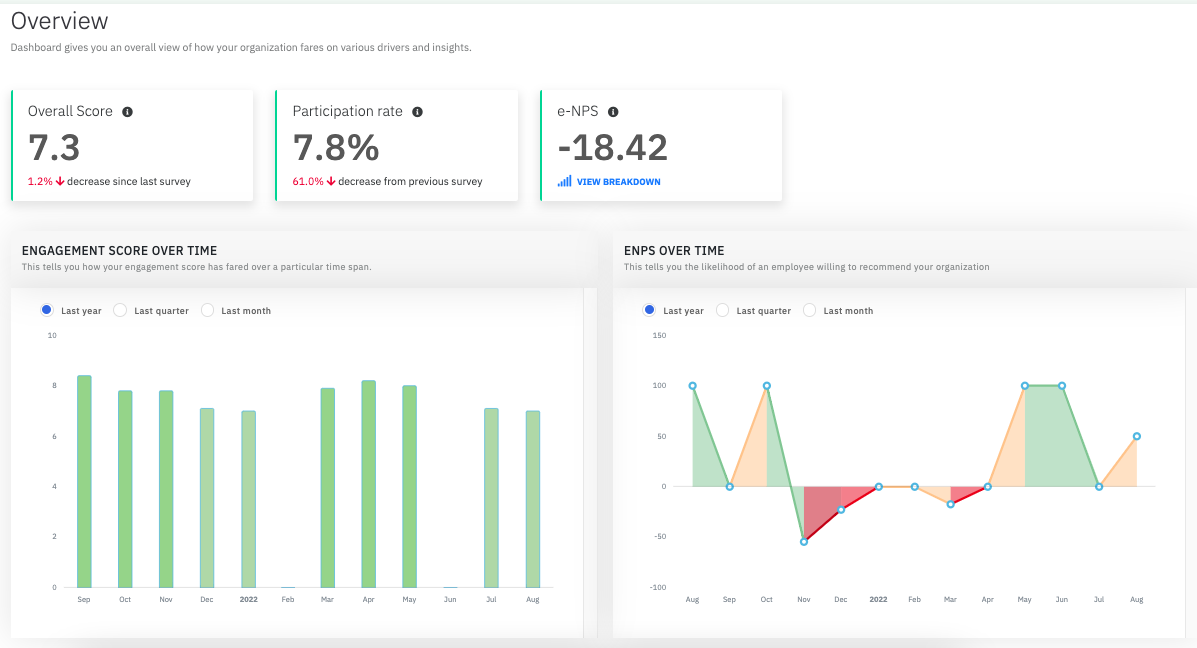
Overview
This gives you an overall view of how your organization fares on various aspects over a period of time.

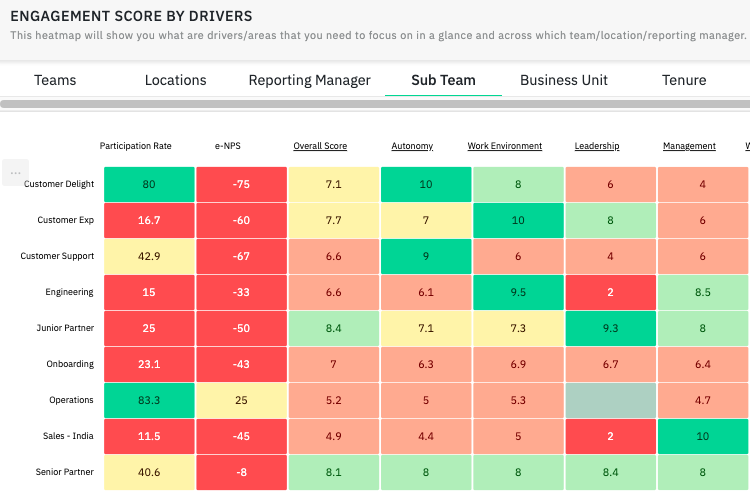
Engagement Scores by Drivers
Engagement scores by drivers, also generally called as heatmap, depicts the performance of each demographics against various drivers.
CultureMonkey's heatmap layout makes it easy for you to, at a glance, identify the things that are going well and areas that need attention.
A team with just two employees might show up on this list if they've participated in multiple surveys and the total participant count across those surveys is at least five, which is the minimum threshold.

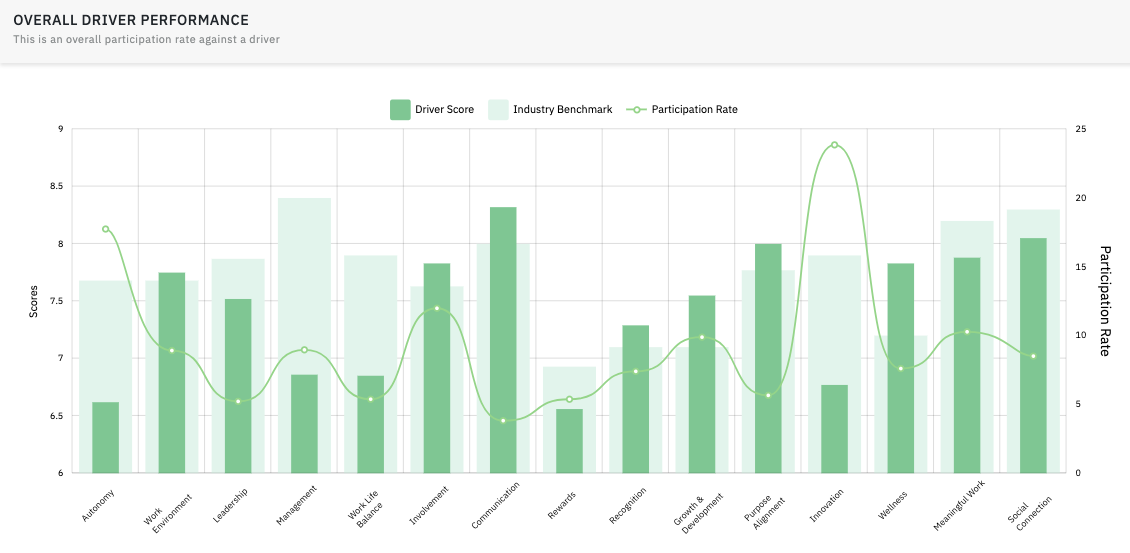
Overall Driver Performance
The overall driver performance enables you to comprehend the total participation rates and scores received for each driver across surveys.

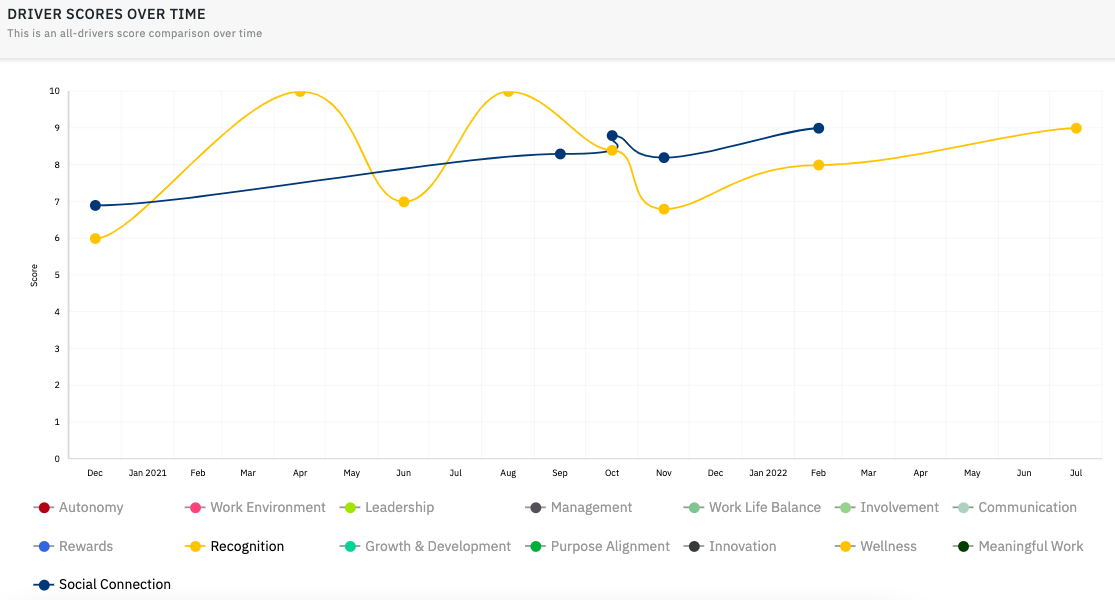
Driver Scores Over-time
The Admin Dashboard lets you keep track of driver scores over time, from the very first survey to the most recent one. This gives you valuable insights and helps you take proactive actions.
Custom drivers or attributes aren't part of the heatmap or graphs because they aren't included in the dashboard's features.

Please refer to survey reports in the Reports section for individual survey results.
Related Articles
Manager Dashboard: A quick guide
Dashboard Overview Manager Dashboard is a consolidated view of all survey responses garnered over time. The toggle to switch between direct & indirect reports is available for managers having more than 5 direct employees reporting into them. Scores ...Adding Super-Admins, Sub-Admins & Managers
If you are already a Super-admin on CultureMonkey, you will have the rights to invite your associates as admins on the platform provided, they should be a part of CultureMonkey's employee database. Please note that at any given point of time, an ...Roles in CultureMonkey
CultureMonkey offers different roles with varying levels of access Super-Admin As a Super-admin, you are the master administrator on the platform who has access to all modules on CultureMonkey. Sub-Admin A Sub-admin can create, launch surveys, and ...Navigating through CultureMonkey
CultureMonkey is designed in a way that all the modules are divided into different sections like: Listen Analyse Act General You can navigate from one module to another using the side panel which is in the left side of the screen Dashboard Dashboard ...How to Invite Managers to the Platform
Who can use this feature? Available to all super admins, not available to sub-admins and managers. Inviting a single/few manager Tip? The best time to carry out this activity is only when you want to invite no more than three to four managers at a ...